Different ways to tell a story.

The Sentinel— As a staff writer for the Sentinel, I was able to create artifacts that demonstrate my attempt and continual effort to understand journalism and the world of news writing. Sentinel stories are text-driven with a single picture sometimes included for the thumbnail.
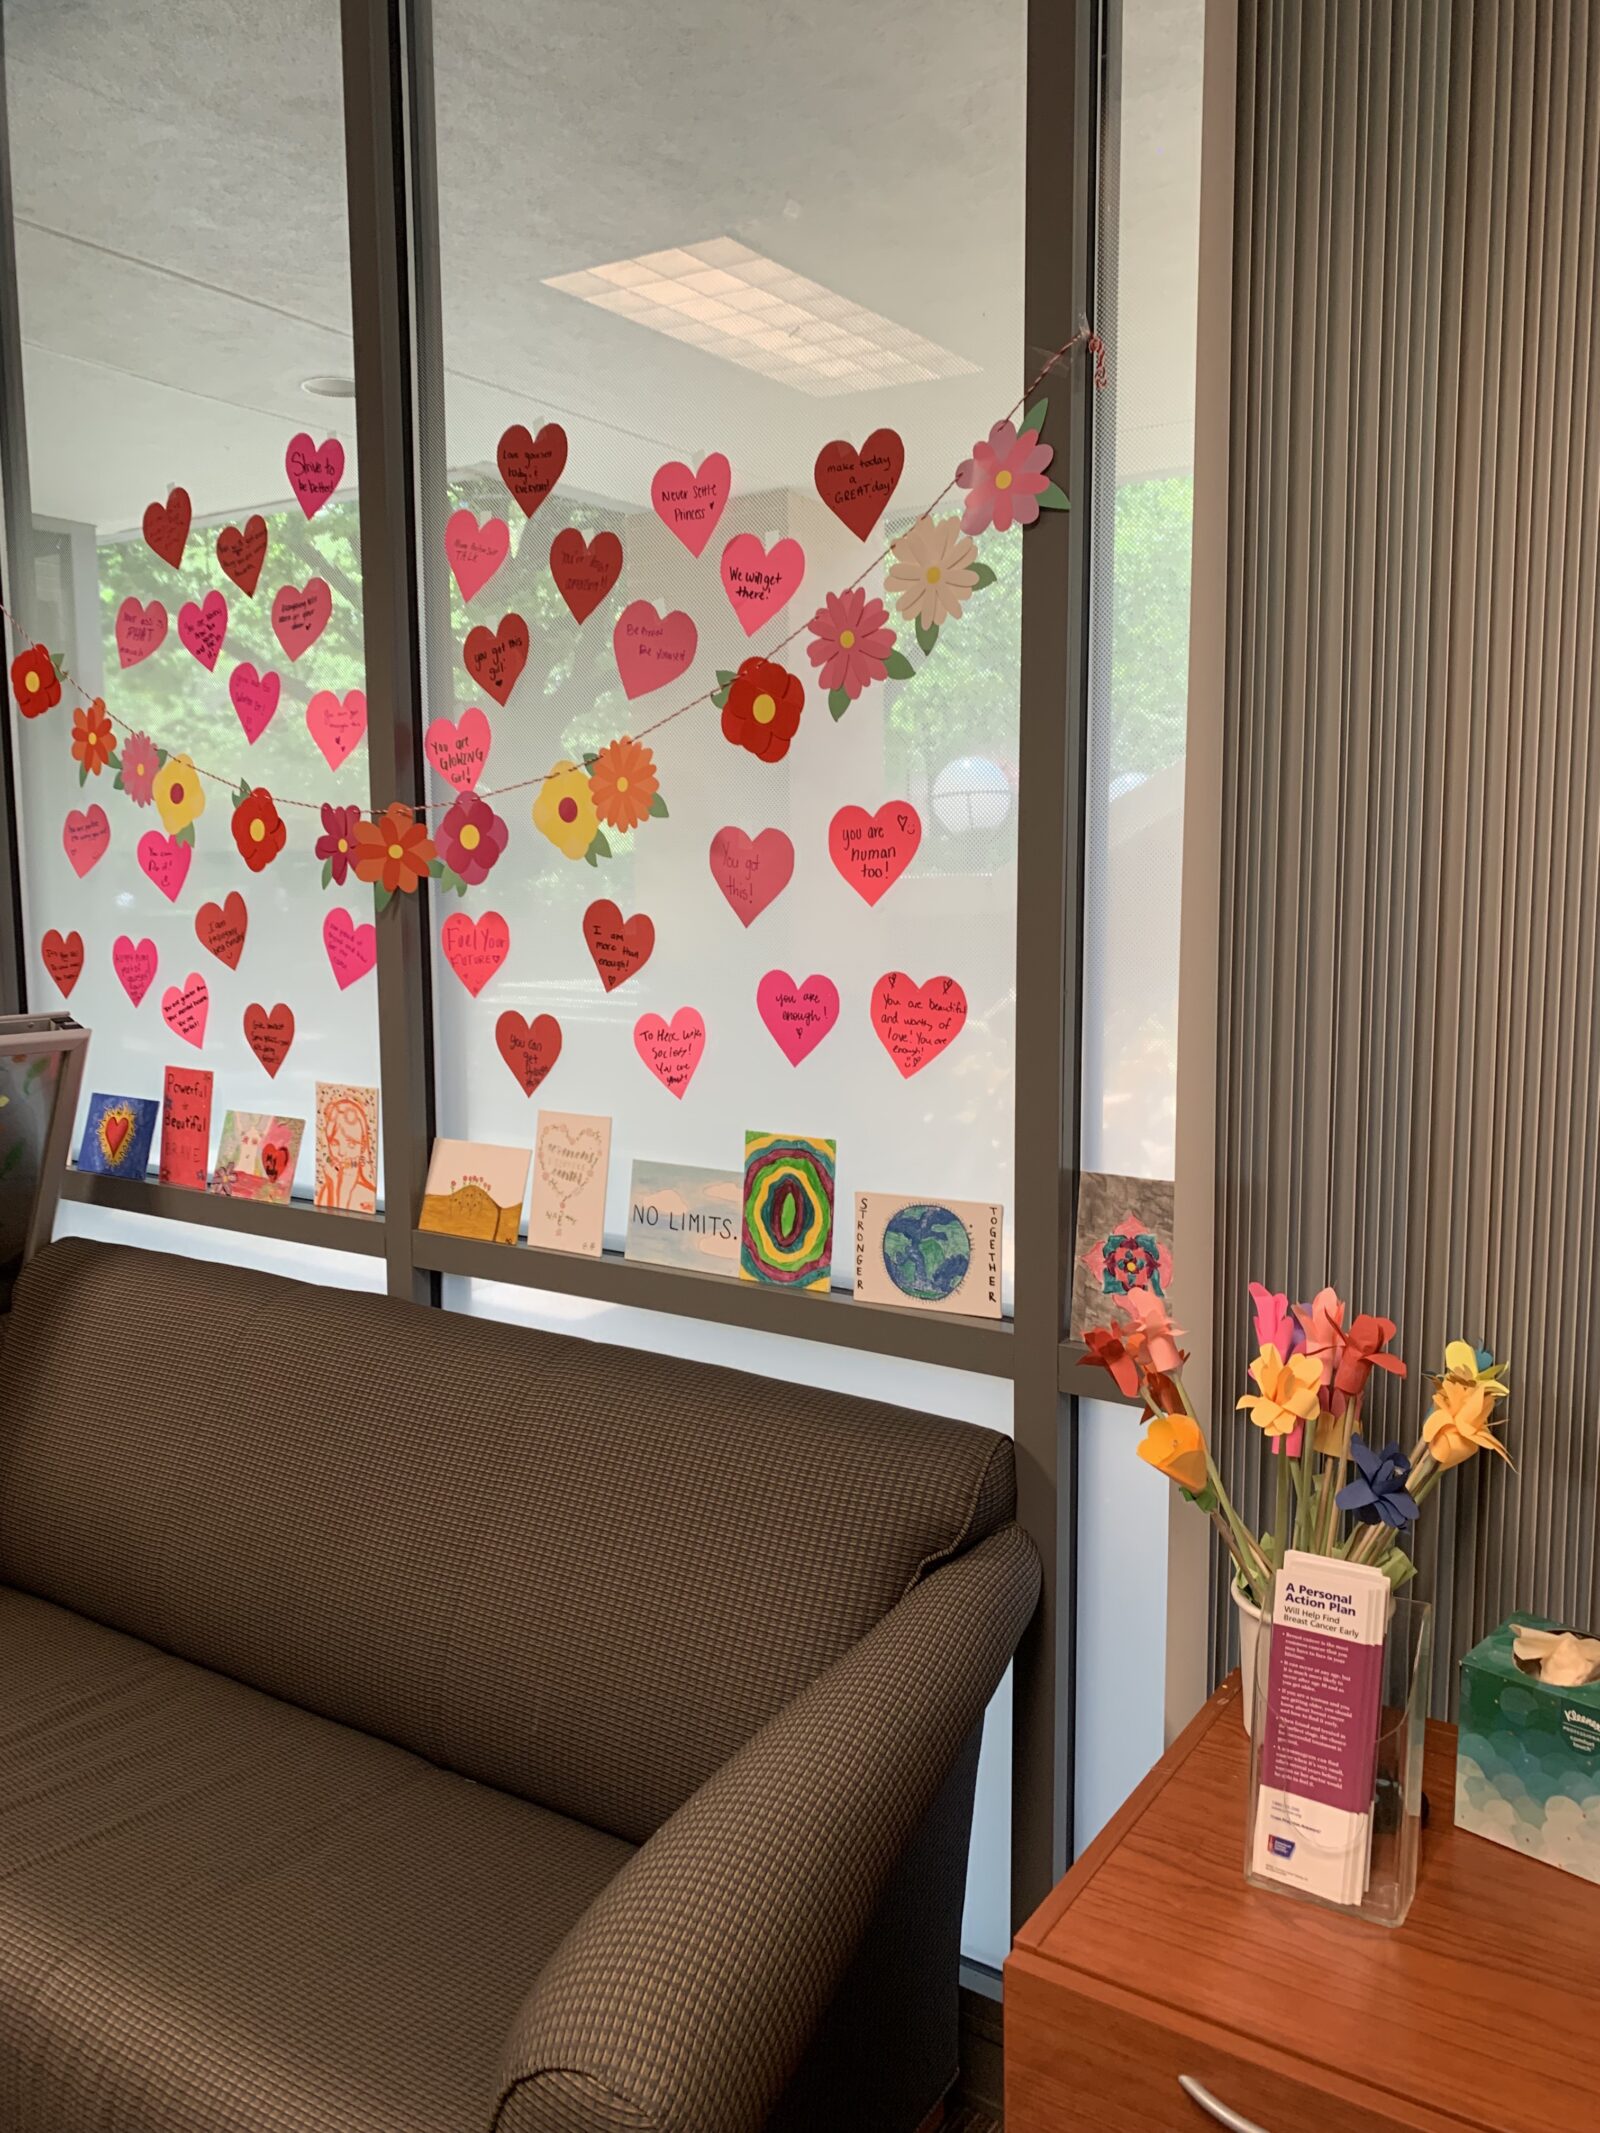
Text article— The women’s resource center article shows the importance of incorporating headings, subheads and lists to text-driven stories. ‘Chunking’ information improves the flow of stories, specifically those that lack multimodal components.

Data article— Government databases are one of the easiest ways to locate datasets. Writers can then practice mining, combining, and turning numbers & statistics into a visually appealing story. For example, analyzing Fifth graders’ performance on a state ELA Assessment in Bartow allowed me to see what type of students scored proficient or higher.
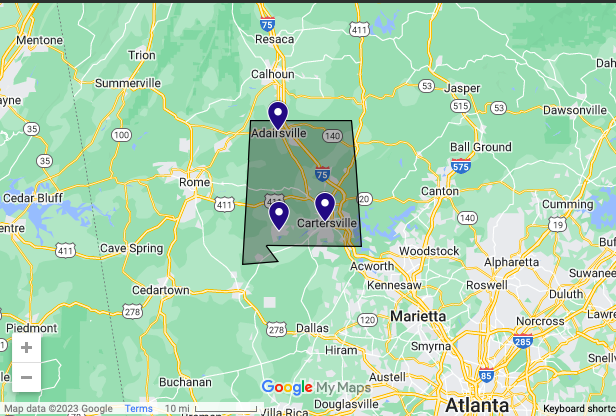
Map article — Maps are great for news stories that are based on specific locations. They keep readers engaged by providing extra context like where a local accident occurred or national weather data. This story discusses the number of library card holders for the Bartow County library system and how funding is connected to that number. It concludes by listing the substantial resources the BCLS provides for those communities in the shaded area.
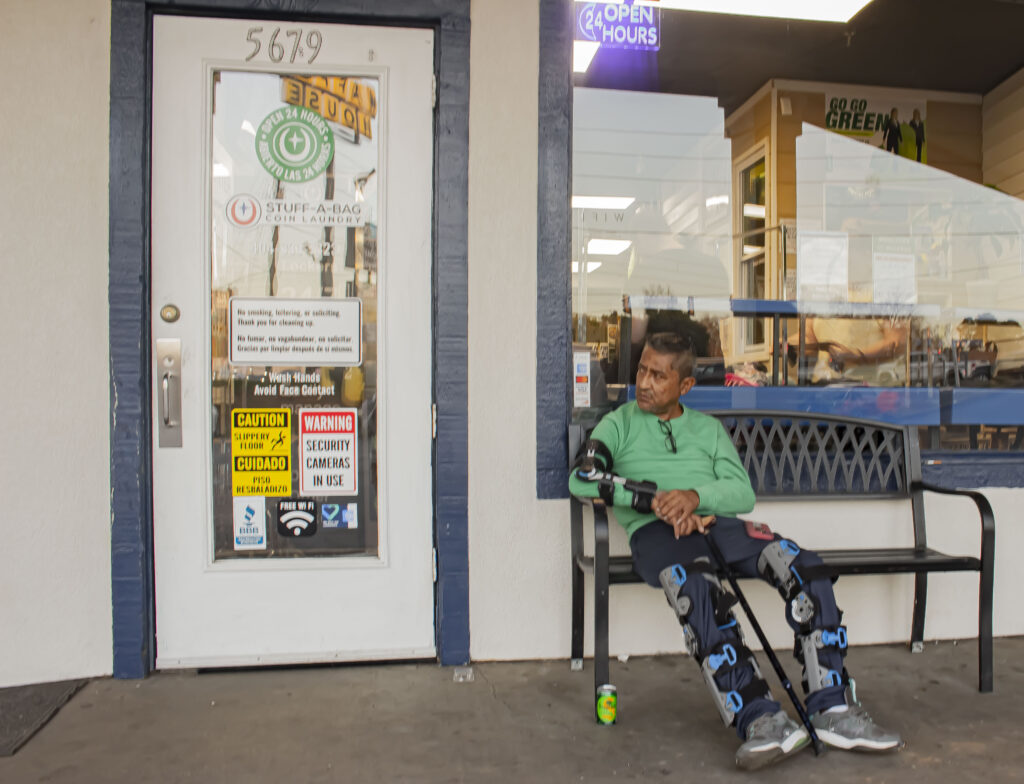
Photo essay— In photojournalism, photographs replace text with every shot representing a line of a story. The struggles of a Mexican immigrant worker is a profile or day in the life of an Acworth man who experienced a debilitating construction accident. The human ability to survive and overcome obstacles is incredible, often drawing strength and power from sources of love.
“Being deeply loved by someone gives you strength, while loving someone deeply gives you courage.” – Lao Tzu
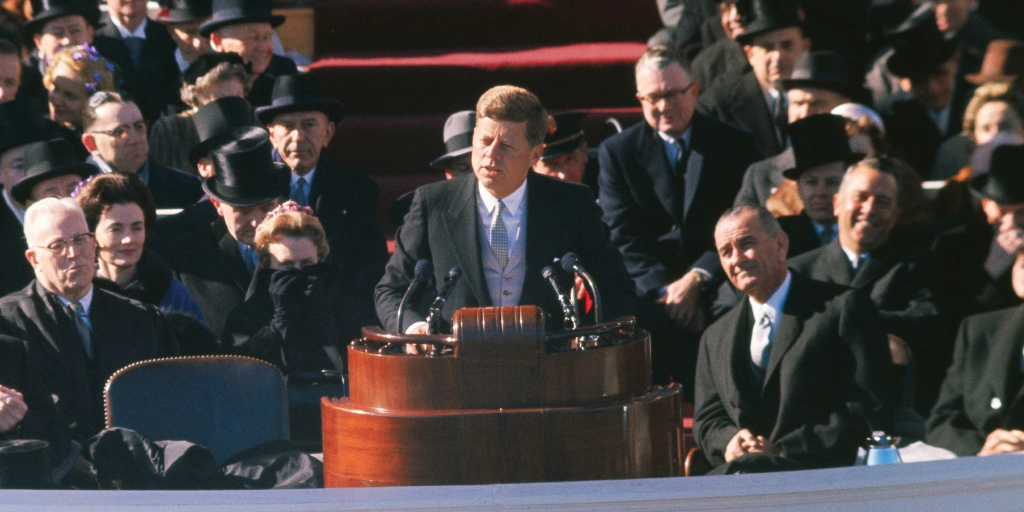
Real-time coverage article— The three phases and/or states of coverage for an upcoming event include the pre-game, game on, and post-game. These types of stories allow the viewer to follow along while things are happening. Uses a combination of text, pictures, maps, and videos to present up-to-date information.
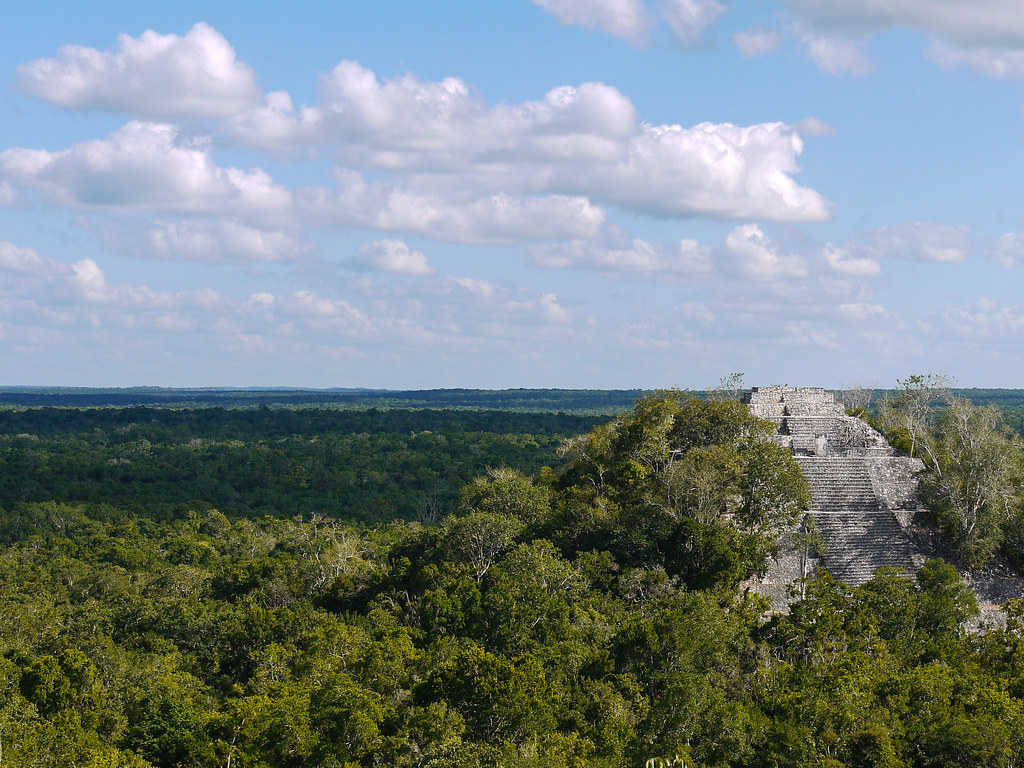
Infographic— This is a great tool for displaying and breaking down complex information. Data-visualization has become prominent because it allows audiences to quickly gather and absorb new concepts and facts. Here, data was used to show the stark impact the Maya Train Project will have on the Calakmul Jungle’s biodiversity in Mexico.
